Desktop Tools & Network Monitoring Guide for Web3 Engineers
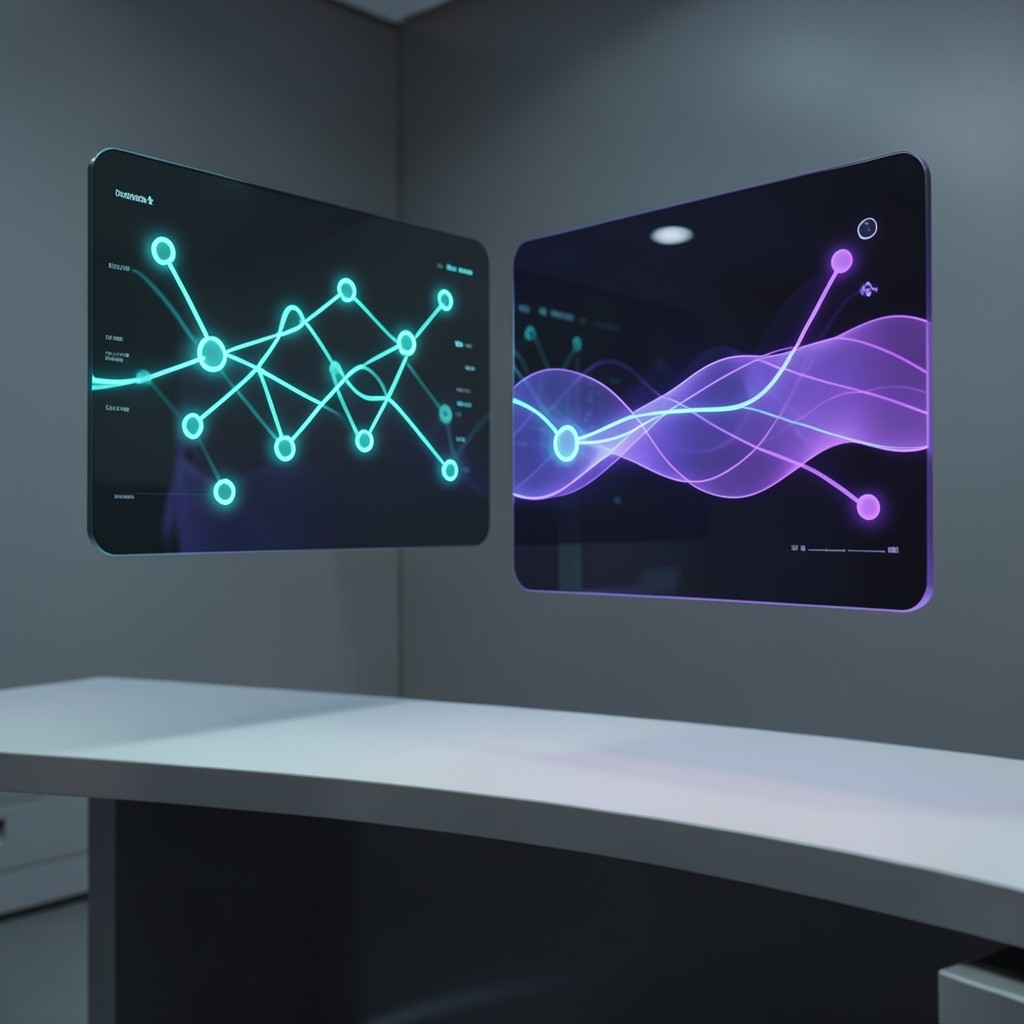
Operating and studying decentralized infrastructure requires dedicated observation and diagnostic software. Because node software runs headlessly on Linux servers, engineers and researchers rely on desktop monitoring consoles, telemetry exporters, and terminal inspection utilities to track network health, peer propagation, and consensus rounds.
This educational guide details the primary categories of diagnostic tooling used by distributed systems engineers to observe and research decentralized networks.
1. Node Telemetry & Metrics Exporters
Decentralized nodes expose operational telemetry through standardized metric protocols (most commonly Prometheus formats). Node metrics provide quantitative visibility into the node’s internal state:
┌─────────────────┐       ┌─────────────────┐       ┌─────────────────┐
│ Node Prometheus │ ────► │ Prometheus Time │ ────► │ Desktop Grafana │
│ Exporter (:9100)│       │ Series Database │       │ Health Dashboard│
└─────────────────┘       └─────────────────┘       └─────────────────┘
Key Metrics to Monitor:
- Consensus Round Latency: Time elapsed (in milliseconds) between block proposal broadcast and $2/3 + 1$ vote aggregation.
- Peer Count & Topology Dispersion: The number of active inbound and outbound P2P connections, and geo-spatial IP distribution.
- Mempool Saturation: Count of pending transactions queued for inclusion and memory allocation buffers.
- Disk I/O Write Amplification: Storage engine (RocksDB/Pebble) compaction frequency and disk write latency per block commit.
2. Desktop Block Explorers & Ledger Visualizers
While web-based block explorers serve general queries, desktop ledger analyzers provide researchers with granular transaction trace inspection and offline database indexing:
- Local Ledger Parsers: Desktop utilities that open local raw ledger snapshot files to inspect state trie structures, account storage slots, and byte-level state diffs without connecting to external servers.
- Network Topology Visualizers: 3D and graph-based desktop visualizers that plot live peer gossip traffic, illustrating how block proposals propagate across international internet exchanges.
- Transaction Simulation Consoles: Sandboxed environments allowing developers to step through smart contract execution bytecode opcode by opcode, inspecting the program counter and stack memory states.
3. Terminal CLI Diagnostic Utilities
For system administrators working over SSH, command-line utilities provide fast, scriptable inspection:
- Node Status CLI: Querying node synchronization height, current peer list, and consensus participation status directly via local IPC sockets.
- Network Benchmarking Scripts: Measuring round-trip ICMP and TCP ping latency to global bootstrap nodes to identify suboptimal routing paths.
- Log Aggregation Daemons (Loki / Vector): Streaming structured JSON node logs to centralized query consoles to filter for warning patterns (such as missed slot proposals or dropped gossip packets).
4. Setting Up an Educational Local Testnet Sandbox
To study consensus behavior safely without impacting public networks, students and engineers can launch an isolated multi-node testnet on a single desktop workstation using containerized environments:
- Docker Compose Mesh: Launch four lightweight validator containers running on an isolated virtual bridge network.
- Chaos Injection: Use Linux
traffic control(tc) utilities to inject simulated packet loss (e.g. $5%$ drop rate) or synthetic $150\text{ms}$ latency delays between specific containers. - Observing Consensus Resilience: Monitor how Byzantine consensus algorithms handle the injected partition, verifying that voting thresholds adapt without causing chain splits.
Summary
Diagnostic tools and telemetry pipelines turn black-box node binaries into transparent, observable systems. To learn how to deploy and configure complete observability stacks in a hands-on environment, review our Validator Architecture Workshop or browse our Curriculum & Study Tracks.
Academic & Non-Commercial Citation
This educational material is published under open academic research guidelines for study and engineering development. References to Dime protocols are strictly for identification and educational purposes.